The true cost of menstrual health care around the world
Ever since I converted to using a menstrual cup, the aisle with all the menstrual health products has not been of much interest to me anymore. Another perk of having switched to a menstrual cup is that whenever I come across discussions about the #tampontax, I feel lucky to have discovered reusable menstrual care products.
So not too long ago, I passed by the “feminine care” aisle in the supermarket by chance and, just out of curiosity, checked the prices. Looking at the prices I started to wonder: In Spain (where I currently live), a package of 32 tampons costs 4.99 €. I’m originally from Germany, where income is a little higher but as far as I can remember, the price for a pack of tampons is cheaper. And then I couldn’t stop myself from wondering about the cost for period products in other countries? And how about the relation between the product’s price and the country’s overall economic situation? Next day in the Ruby Cup office, I knew that it was time to have a closer look at some data. Unfortunately, I couldn't find any comparative stats or insights on this. So I set off to build my own Menstrual Health Cost Index.
Calculating the cost of menstrual care products around the world
In case you're wondering why this decision came to me so naturally, it’s because it's not the first time I’m taking to menstrual statistics. A while back I had a closer look at how we have been calculating the average amount of menstrual blood loss for the past decades - and made insane discoveries. So, this is how I got started. First I chose the countries I wanted to compare, a mixture of high, middle and low-income countries. I then calculated how much one tampon would cost in Euros in each country:

The cost for one tampon ranges from 0.05 Euros (Vietnam) to 0.36 Euros (Iceland) with the majority of the prices ranging around 0.14 Euros. Then I made a scatter plot where I look at the cost of a single tampon with the GDP per capita of each country on the y-axis. 
In this chart, countries with a similar GDP are positioned close together and you can see that the price for one tampon is very different. The GDP per capita is calculated by summing up all values of goods and services produced within one country during one year and then dividing the sum by the average population. It is commonly used to determine a country’s economic performance, though it does not take into account the distribution of wealth within this country.
What's the average cost of a yearly supply of tampons?
The next step for calculating a proper Menstrual-Health-Cost-Index was to sum up the average cost for a yearly supply of tampons for each country. Caution, we are now entering the territory of pure statistical modeling, so there are some assumptions to take into account for the following which for sure are not 1:1 transferable to the “real world”. I'm just mentioning this because I think it’s extremely important to keep things transparent and in the relative perspective.
1. For my calculations, I consider that a person only uses tampons or pads for their period.
2. To keep it simple I based all further calculation on the following:
- a) On average, periods last 4 days (1).
- b) The American College of Obstetricians estimates that the average number of disposable items used per period day lies between 3 and 6 items (2). So I kept the median number of 4.5 items for my calculations.
- c) This leads to an average of 216 tampons per year per person.
- d) To all of those with actual four day periods: I envy you! So, now that the base is set, let’s dive deeper into the Menstrual-Health-Cost-Index-Formula:

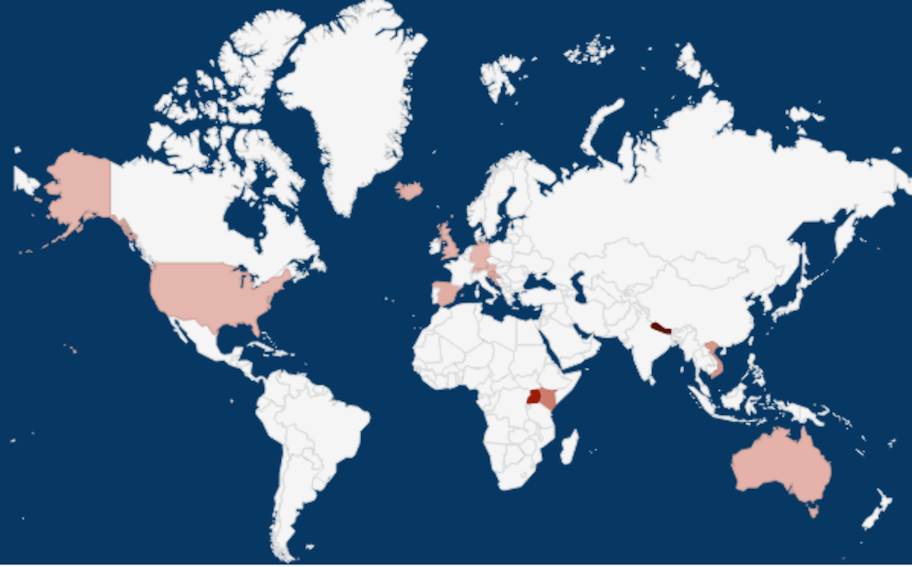
The results show how many percent of the GDP per capita would, on average, be spent for purchasing tampons for a very average consumption of period items, e.g. in Australia it is 0.07% (which is one of the lowest values) whereas in Kenya it is 1.94% and in Nepal even more than 5%. Check out the following map: The darker the color red is, the higher the percentage of an average annual supply of tampons relative to the GDP per country. Otherwise said: The more expensive the cost is compared to the general economic performance of the country, the darker the red.

Menstrual Health Cost Index per Country: The darker the color red, the higher the cost of an average annual supply of tampons relative to the GDP per country. The map shows that for all low-income countries (Kenya, Uganda, Nepal) the cost for a yearly supply of tampons is proportionally higher than in middle and high-income countries.
What's the average cost of a yearly supply of pads?
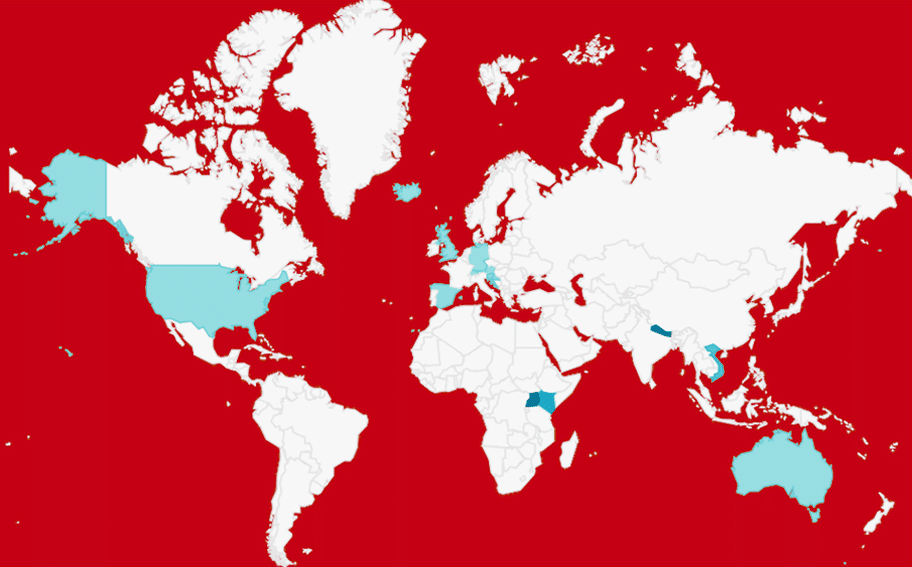
I made the same calculations for pads. The average price for one pad is lowest in Uganda, Kenya and Vietnam (around 0.05 €) and highest in Switzerland (0.36€). And although pads seem to be cheaper, they are not necessarily more affordable. A look the pad prices in relation to the GDP shows that very clearly.

The Menstrual-Health-Cost-Index states that a yearly supply of pads in Switzerland corresponds to approximately 0.04% of the Swiss GDP per capita whereas in Kenya it’s 1.1% and in Uganda even 3.1%.

Menstrual Health Cost Index per Country: The darker the color red, the higher the cost of an average annual supply of pads relative to the GDP per country.
Periods are the most expensive in low- and middle-income countries
The Menstrual-Health-Cost-Index shows very clearly that in low- and middle-income countries period products are extremely expensive compared to the yearly GDP per capita. But it’s not only global inequality that is engendered by costs for menstrual products. It’s also within countries that this engenders inequalities. Let’s look at an example in Germany. The median household income for one person in 2017 is 1760€ (which means 50% of single households are above, and 50% are beneath this value) (3). A person with a very average period who uses 18 pads spends 0.2% of their monthly income on period supply. For a low income of 705€ it would already be 0.4% of their income spent on pads. For a heavy bleeder, this could still increase.

It's very similar in Kenya. The median income for one person in 2015 is about 80000 Kenyan Shilling per month (4), corresponding to ca. 648€. This means that an average of 0.2% of the income would be spent on period product supplies for one person. A Kenyan with a low income of 25000 Kenyan Shilling (202€) would already have to pay 0.5% of their earnings to cover the monthly costs of menstrual care products. That is if that one person uses an average of 18 items per period. If that person is a heavy flower, 0.7% of their income goes towards 24 items needed. Imagine what this means if a family has four menstruating members...
No matter the country you live in, periods are expensive
The Menstrual Health Cost Index demonstrates how, on a purely economic basis, menstruation can be a burden and reinforce inequality. Just recently the “#FreePeriods”-report in the UK has shown that no matter where you live, period poverty is an issue.
There's a need for multiple approaches to make periods more affordable.
We can already see a lot of new paths leading in this direction. On the legal side, the fight on the tampon tax, for example, has spread from the UK to the US, Germany and other countries. As a result, some states of the US and countries such as France have already acted upon those demands. There are increasing numbers of petitions and calls to make period products more accessible, such as providing them for free in public spaces e.g. in libraries, town halls, schools, etc.are gaining momentum. Entrepreneurs, businesses and NGOs are following the trend towards initiatives that are trying to avoid dependency on overpriced disposable menstrual products.
In recent years the range of menstrual care products, their accessibility and awareness about this topic have increased. Menstrual product donation programs with a long-term impact in mind can be seen as another powerful approach to act upon this menstrual inequity. And on an educational level, we need more access to information about the entire variety of products and transparency about those products.
It's not just about access to the products, but also about information
At Ruby Cup, we also think that it does not just depend on access to products to solve the problem, but also on access to better information for everybody. And when we say everybody, we also mean the non-menstruators.
We need to change the way we talk about periods. We need to liberate these conversations from secrecy and shame so that they can become a public matter and we can find solutions as a society, together. If everyone is involved in these conversations, then we'll be able to understand the inequalities from all the different period experiences throughout society. We'll be able to discuss menstrual health as well as be able to address everyone's menstrual needs when it comes to period products, much better.
Let's aim for that and I’m sure, there is a bright menstrual future ahead. We need everyone to get involved in the conversation about #menstruation so we can understand the inequalities from all the different period experiences throughout society and address everyone's menstrual needs.
How to calculate the price for your own country
If your country is not on my list, here is a quick summary of how you can calculate it for your own country. Step 1: Look up the GDP per capita for your country. A great source is the United Nations Statistics Division. Step 2: Check tampon and pad prices in the nearest supermarket. Divide the total price of the box by the amount of items that it holds. Make sure you use the same currency for GDP and the menstrual products prices. Step 3: Use the formula

_____ Sources: Reed BG, Carr BR. The Normal Menstrual Cycle and the Control of Ovulation. [Updated 2015 May 22]. In: De Groot LJ, Chrousos G, Dungan K, et al., editors. Endotext [Internet]. South Dartmouth (MA): MDText.com, Inc.; 2000-. Available from: https://www.ncbi.nlm.nih.gov/books/NBK279054/ Menstruation in girls and adolescents: using the menstrual cycle as a vital sign. Committee Opinion No. 651. American College of Obstetricians and Gynecologists. Obstet Gynecol 2015;126:e143–6. https://www.acog.org/Clinical-Guidance-and-Publications/Committee-Opinions/Committee-on-Adolescent-Health-Care/Menstruation-in-Girls-and-Adolescents-Using-the-Menstrual-Cycle-as-a-Vital-Sign (3) http://www.arm-und-reich.de/verteilung/mittelschicht.html (4) https://www.knbs.or.ke/kenyans-lotteries-3-secrets-to-beating-the-odds/ Information about the GDP was taken from the United Nations Statistics Division: https://unstats.un.org/unsd/snaama/selbasicFast.asp All tampon prices were taken from http://expatistan.com/ For the pads prices, I checked different online stores (which might lead to a slight bias as prices in physical stores might vary).
 Your Account
Iniciar sesión
 Basket


